

Be An Earth System Trend Detective!
Your challenge is to create a tool that can select variables measured by Earth science missions or produced by Earth science models, visualize how they change over time, and determine what is changing, where it is changing, how much it is changing, and if these changes are what scientists call “significant.”
- Challenge video
- 13 resources
- Other agenciesCSA (Canadian Space Agency)2 partner agencies
- 6 min read
Summary
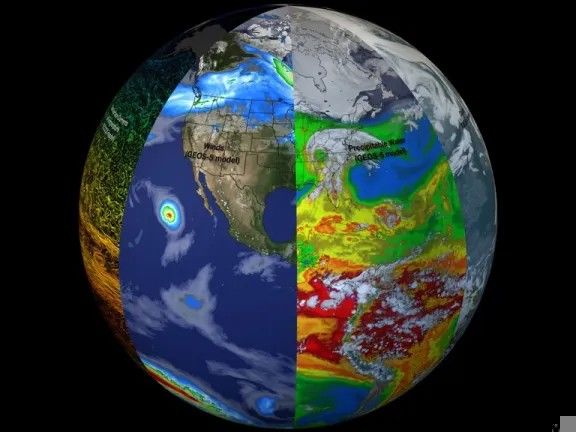
Change is always occurring in the Earth’s interconnected environmental system, and when it runs in a consistent direction – rising or falling, increasing or decreasing, thickening or thinning – measured variables reflect it. But a measured Earth science data variable can trend one way in one region and the opposite way in another, even when the same process drives both. The multitude of Earth science data variables makes it difficult to select variables that could indicate change, and to then perform an analysis on the selected variables. Your challenge is to create a tool that can select variables measured by Earth science missions or produced by Earth science models, visualize how they change over time, and determine what is changing, where it is changing, how much it is changing, and if these changes are what scientists call “significant.”
Background
Instruments on satellites observe many different aspects of the Earth system: on land, in the atmosphere, and in the oceans. Global models also use satellite instrument data and other kinds of data to examine and analyze the Earth system. One important reason for doing this is to observe and characterize changes in the Earth system. Changes, especially those moving in a particular direction over time – a trend – indicate both the processes causing such changes and the processes that will respond to them.
One complicating factor in this work is the wide variety of variables that can be studied. Another is that changes in a particular variable can move in one direction in one region and in the opposite direction in another, even when both trends are caused by the same process! So there are two important parts to this problem: finding variables that are trending, from simple ones like temperature and rainfall to more complex ones like evaporation or streamflow; and analyzing trends in particular regions of the land, ocean, or even levels of the atmosphere.
Instruments such as the Moderate Resolution Imaging Spectroradiometer (MODIS), the Ozone Monitoring Instrument (OMI), the Atmospheric Infrared Sounder (AIRS), and the Global Precipitation Measurement (GPM) provide analyzable variables. Global models – notably the Modern Era Retrospective analysis for Research and Applications, Version 2 (MERRA-2) and the Global Land Data Assimilation System (GLDAS) – provide many more. Finding, analyzing, and relating significant trends to the processes causing them is one of the most important uses of NASA Earth science data.
Objectives
A successful response to this challenge will bring together several important elements.
The first is to identify Earth science variables of interest that can be investigated for potential trends. As the Background notes, NASA and other space agencies offer numerous variables, some familiar and some more specialized for use by particular branches of science.
The second is to acquire the data variables for a particular region, since most trends in the data will not be global – though some trends can be!
The third is to generate and visualize a time series for the variable and region of interest over a long enough period of time to allow statistical analysis.
The final element of the challenge is to perform a basic statistical analysis of that time series, indicating the rate of change over time, and to test the trend’s significance using methods such as a t-test, the Mann-Kendall test, or confidence intervals.
Data sites offer tools that generate time series, and statistical analysis packages provide basic significance testing. A response that does both the visualization and the analysis meets the full scope of this challenge.
Potential considerations
You may (but are not required to) consider the following:
Audience
- This challenge involves science data and statistical analysis, so the likely audience is high school and college students, along with members of the public who have some scientific background.
- Providing simple definitions of the variables would help these users considerably.
- The concept is to help the users become data detectives – finding variables of interest, then determining whether those variables show a trend and whether that trend is significant.
Approach
- Users could potentially respond to a short series of questions about what or where they would like to investigate, and then the answers to the questions would allow searching of related data variables. It would be highly useful to provide a couple of demonstration examples that the user could watch and would help them understand how the tool works.
- While not required, SI could be useful here to identify data with the potential to show trends in particular areas, drawing on either news articles and research papers or the characteristics of a region such as a desert, rain forest, tidal estuary, or the atmosphere above a large city.
Working with the data
- Earth science data are available at several different temporal resolutions – hourly, 3-hourly, daily, and monthly. For this challenge, daily and monthly data are likely the easiest to process.
- Finding a trend is interesting even if it doesn’t reach the level of significance. Sometimes all a trend needs to become significant is a longer period for the data to be acquired.
- Consider looking for publicly available tools for plotting hydrological data offered by outside organizations like the Consortium of Universities for the Advancement of Hydrologic Science, Inc. (CUAHSI).
Trend analysis with Earth science data can be complex. Trends can be non-linear, and some are not evident unless regular cycles, such as the seasonal cycle, are removed. More complex trend analyses are beyond the scope envisioned for this challenge; detecting and analyzing linear trends would be a great start.
NASA does not endorse any non-U.S. Government entity and is not responsible for information contained on non-U.S. Government websites. For non-U.S. Government websites, participants must comply with any data use parameters of that specific website.
NASA data and resources
giovanni.gsfc.nasa.gov
Giovanni (opens in a new tab)
Versatile tool that provides menus of numerous data variables, and allows generation of time series and download of the time series data.disc.gsfc.nasa.gov
Hydrology Time Series (opens in a new tab)
Allows generation of time-series with hydrological data.appeears.earthdatacloud.nasa.gov
AppEEARS (opens in a new tab)
Offers a simple and efficient way to access and transform geospatial data from a variety of federal data archives. Includes time-series generation.ncei.noaa.govNon-NASA site
Climate Data Online (CDO) (opens in a new tab)
CDO provides free access to NCDC's archive of global historical weather and climate data in addition to station history information. This site includes a mapping tool.ntrs.nasa.gov
Time-Series Analysis of Remotely-Sensed SeaWiFS Chlorophyll in River-Influenced Coastal Regions (opens in a new tab)
Research article demonstrating time-series creation and significance testing.
Space agency partner resources
Other agencies
climexp.knmi.nlNon-NASA site
Royal Netherlands Meteorological Institute (KNMI) Climate Explorer (opens in a new tab)
The KNMI Climate Explorer is a web-based scientific analysis tool developed and maintained by the KNMI. It is designed to help researchers, students, and climate analysts explore, analyze, and visualize climate data from a wide range of sources.medium.comNon-NASA site
Statistical test methods to detect trends in time series data (opens in a new tab)
Article about testing trends in data.statsig.comNon-NASA site
A Comprehensive Guide to Statistical Significance (opens in a new tab)
A guide to significance testing.
CSA (Canadian Space Agency)
donnees-data.asc-csa.gc.caNon-NASA site
Radarsat Constellation Mission (RCM) - Data (opens in a new tab)
The RADARSAT Constellation Mission (RCM) is Canada's new generation of Earth observation satellites. The RCM includes a trio of Earth observation satellites, capable of scanning Earth day or night and in any weather conditions. The RCM is designed to provide effective solutions in three main areas: Maritime surveillance (ice, surface wind, oil pollution and ship monitoring); Disaster management (mitigation, warning, response and recovery); and Ecosystem monitoring (agriculture, wetlands, forestry and coastal change monitoring).geo.caNon-NASA site
Geo.ca (opens in a new tab)
GEO.ca is the definitive source for Canada’s open geospatial information. Some of this data might be helpful for monitoring environmental issues in Canada.asc-csa.gc.caNon-NASA site
SWOT Mission - Information (opens in a new tab)
The SWOT mission is providing us with new and detailed information on one of the most important resources we share – water. Led by NASA and France's space agency (CNES), in collaboration with the CSA and the UK Space Agency, SWOT surveys 90% of Earth's surface water, measuring changes in water surface elevation for lakes, rivers, reservoirs, and oceans over time.asc-csa.gc.caNon-NASA site
Monitoring and protecting our ecosystem from space (opens in a new tab)
This website provides more information on ways satellite data can help monitor changes and promote the responsible use of land and natural resources to protect the ecosystem.github.comNon-NASA site
Synthetic Aperture Radar python Tutorial (opens in a new tab)
This tutorial demonstrates how to work with SAR imagery using Python and QGIS. It includes easy and practical steps for accessing and visualizing data.
From the NASA Space Apps Challenge. The official page is the final word on this challenge.
Built in Athlone
The 2 projects Athlone teams submitted for this challenge at HackAthlone 2026, from the teams’ own Space Apps pages. Links open in a new tab.
- 2026
- Best Use of Open Data
Erevna
Be An Earth System Trend Detective!
Earth Trend Globe is an interactive 3D globe that shows how Earth’s climate has changed since 1981. It also shows which of those changes are real. We used 45 years of NASA POWER data (MERRA-2, CERES and GEWEX SRB) for six variables: temperature, humidity, rainfall, sunlight, air pollution and ozone. The data covers 16,020 points around the world. Users can click anywhere, choose a region, or draw their own area. Each area gets a trend per decade and a significance test that allows for month-to-month memory in the data. If a change isn’t clear yet, the app says how many more years of data it would need. A “data detective” mode suggests places worth exploring. Live storms, floods and fires from NASA EONET are linked to the long-term trend at the same spot. A statistical outlook, tested on 2008 to 2025, shows what 2040 could look like for 184 areas. This matters because a single heatwave or flood is easy to mistake for a trend. Our globe separates real change from natural ups and downs, and it explains everything in plain language. It is honest about what the data does and doesn’t show.
Read moreShow less
Team: Jovan Tomy, Ryan Jyothis, Dhananjai Sudarshan, Síofra Dennehy, Brandon Shumba
- 2026
TerraLens
by The Cosmic Cartographers
Be An Earth System Trend Detective!
TerraLens starts from a place and finds what is really changing there. Pick one of five regions (Ireland, Iberia, the Sahel, NW South Asia or the US Southwest), and TerraLens tests five NASA Earth-science variables over 1980–2025: air temperature, soil moisture, evapotranspiration, precipitation and aerosol, all from MERRA-2 via NASA GES DISC. It ranks what is changing, shows how fast with a 95% confidence interval, and gives each variable a plain verdict. We adjust every p-value with the Benjamini–Hochberg method to keep false discoveries. Opposite Trends puts two places side by side: US Southwest rainfall is falling while NW South Asia’s is rising. The Time Machine shows how the verdict changes with the years you choose, and how long a record would be needed to detect a trend that isn’t proven yet. This covers every step the challenge asks for: choosing variables, getting regional data, building long time series, and measuring both the rate and the significance of each trend. It matters because charting tools draw a trend line without saying whether it is real. TerraLens tells students and the public what is changing, how sure we can be, and when the honest answer is “not proven yet”.
Read moreShow less
Team: Bhargav Lalit Chaudhari, Parth Soni, Kevin Henry, Nandini Hazarika