

Dancing with the SARs
Your challenge is to build an interactive application that uses radar remote sensing data from the NASA-ISRO Synthetic Aperture Radar (NISAR) mission to track and visualize one or more types of surface change at locations around the world.
- 14 resources
- CSA (Canadian Space Agency)
 National Space Activities Commission of Argentina (CONAE)2 partner agencies
- 6 min read
Summary
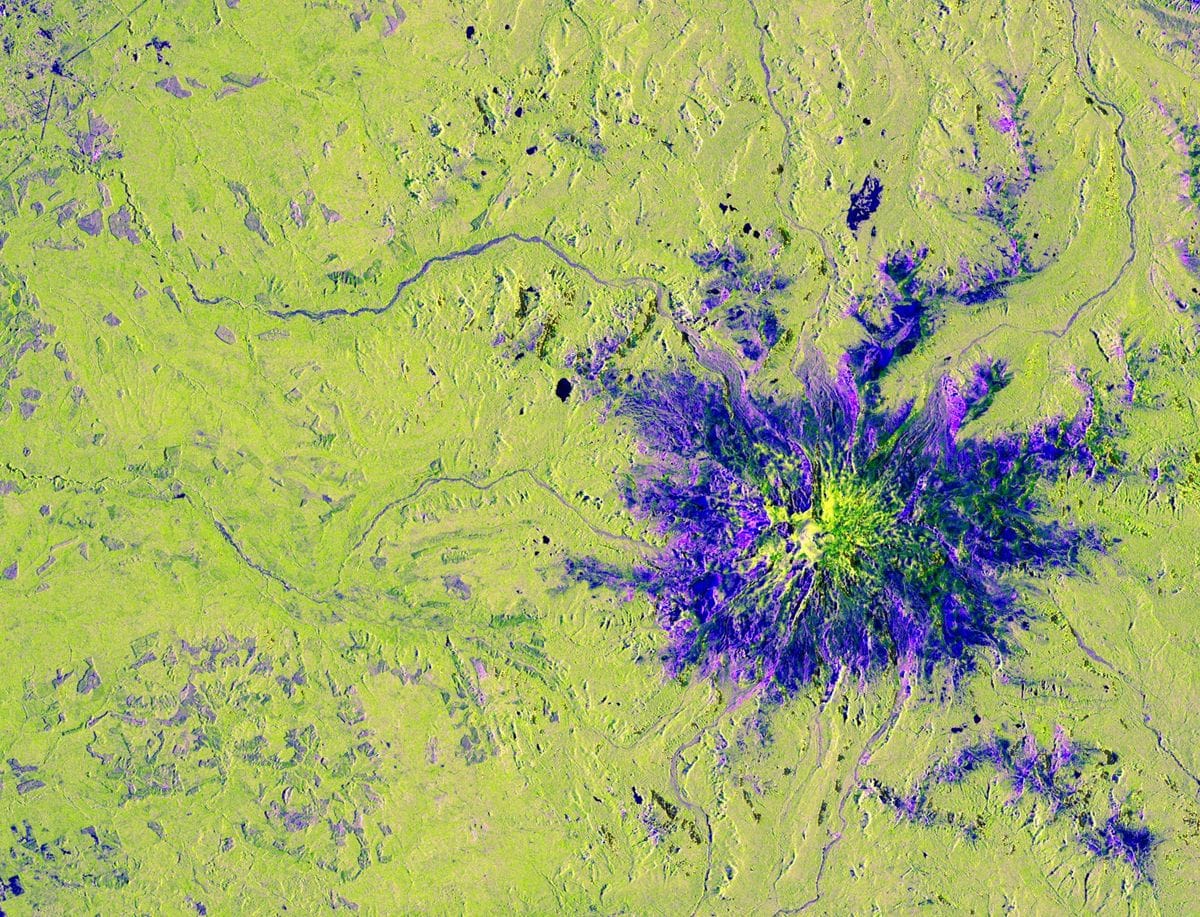
Earth's surface is an endless dance of natural processes and human activities, but these changes are often difficult to visualize, understand, and communicate. From wetland loss to forest wildfires, earthquakes, farming activities, glacier movement, and more, Earth is in a constant waltz of surface changes. Your challenge is to build an interactive application that uses radar remote sensing data from the NASA-ISRO Synthetic Aperture Radar (NISAR) mission to track and visualize one or more types of surface change at locations around the world.
Background
Earth remote sensing helps us acquire information from a bird’s eye view. Space-borne and airborne instruments image the planet and contribute to Earth observations that help decision makers in lieu of or supplement their field surveys. The most common source of energy that these instruments use is from the Sun, which reflects from objects and surfaces on the ground back to the instrument. The amount of this energy varies by the wavelength within the electromagnetic spectrum, and we can use this spectral fingerprint to identify water, rocks/minerals, vegetation, etc. These instruments that utilize the Sun’s energy conduct passive remote sensing while radar instruments, such as those we’ll use in this challenge, conduct active remote sensing.
Active instruments emit and receive their own source of energy, and in the case of radar, operate in the microwave band of the electromagnetic spectrum. Radar instruments can be used to study forest structure, soil moisture, wetlands, ocean topography, sea ice, and more. In this challenge, we will download data from SAR (synthetic aperture radar) satellites. SAR “synthesizes” a long antenna by combining a sequence of acquisitions from its actual, shorter antenna to provide higher spatial resolution data. SAR instruments send out a pulse of energy which reacts with the Earth’s surface and is reflected back to the instrument. This collection can be done day or night and even in cloudy weather, which allows for critical data collection during disaster events like oil spills, wildfires, hurricanes, etc.
Radar data is most sensitive to two things: roughness and the dielectric constant. In other words, the radar images are more than just typical satellite images that you may see with your GPS app. This roughness information characterizes the backscatter from Earth’s surface and different polarizations and can tell us something about structure, geometry, and material properties. Since water has a high dielectric constant, SAR data also highlights water bodies, flood inundation, and soil moisture. SAR can also measure fine surface movement on the centimeter scale, such as for earthquakes and land subsidence.
Objectives
On Earth's surface there is an endless dance of natural processes and human activities in constant motion, but these changes are often difficult to visualize, understand and communicate. Wetlands and floodplains are constantly extending and retracting; forest footprints are shrinking from deforestation and wildfires; agricultural lands transform their crop types and health, moisture is swelling and shrinking in soils; glaciers and sea ice are in a constant waltz; and land surfaces are deforming from earthquakes and coastal subsidence. All of these changes have important implications for ecosystems, water resources, agriculture and infrastructures, ultimately impacting local communities.
In this challenge, participants will build an interactive application that leverages radar remote sensing data from NISAR to track and visualize one or more types of surface changes, at locations around the world. Participants are encouraged to design intuitive tools and innovative visualizations, such as interactive change-detection maps, time-series animations, or dashboards, that make NISAR data accessible to a broad audience. The desired outcome is an open-source, user-friendly solution that translates complex radar observations into actionable insights, helping scientists, resource managers, educators, decision-makers, and the public better understand the patterns and rhythms of Earth’s surface at different time steps.
First, pick an interesting study area – this can be your hometown, a tropical wetland, ice sheet, forest wildfire, flooded neighborhood, volcano eruption, etc. - wherever the music calls you! Second, download freely available NISAR data using the list of resources provided. You may want to download supplemental data such as optical images or GIS (geographic information systems) layers to contextualize the SAR imagery. And lastly, present your findings in an interactive digital medium you prefer: a final report, video, presentation slides, story map - even an interpretive dance? Hypothesize the physical drivers behind what you see (or don’t see) in the SAR data. For example, if you are looking at the Amazon Rainforest, why might the vegetation change over time? Which polarizations highlight these changes on land and ice? What future applications of NISAR are possible?
Potential considerations
You may (but are not required to) consider the following:
- Analyze NISAR data with different polarizations and/or different frequencies (from other sensors). Download data from different dates to show a time series and ancillary datasets (population, vegetation type, etc.) to contextualize the study area.
- Show how human drivers (agriculture, industry, etc.) are impacting Earth’s natural resources.
- Focus on compelling storytelling through data visualizations. Your project summary can be in any digital medium you prefer: a final report, video, presentation slides, story map, etc.
- If you are familiar with your study area (e.g., it’s your hometown), you can provide personal context and stories for the SAR imagery.
- Consider making your summary interactive (e.g., image sliders, web maps, etc.).
NASA does not endorse any non-U.S. Government entity and is not responsible for information contained on non-U.S. Government websites. For non-U.S. Government websites, participants must comply with any data use parameters of that specific website.
NASA data and resources
search.earthdata.nasa.gov
NASA Earthdata Search (opens in a new tab)
Earthdata Search enables data discovery, search, comparison, visualization, and access across NASA's Earth science data holdings.search.asf.alaska.eduNon-NASA site
ASF Data Search Vertex (opens in a new tab)
The Alaska Satellite Facility (ASF) operates the NASA archive of SAR data and provides services to researchers supporting NASA's ESDIS project.nisar-docs.asf.alaska.eduNon-NASA site
NISAR Data User Guide (opens in a new tab)
This guide from ASF aims to help those who research and monitor the Earth find all the information they need to know about accessing and working with NISAR data in one place.earthdata.nasa.gov
Intro to Remote Sensing (opens in a new tab)
Learn the basics about remotely-sensed data, from instrument characteristics to different types of resolution to data processing and analysis.earthdata.nasa.gov
Intro to Synthetic Aperture Radar (SAR) (opens in a new tab)
Learn the basics about SAR data, from the roles of frequency and wavelength to polarization and scattering mechanisms.appliedsciences.nasa.gov
NASA ARSET Trainings (opens in a new tab)
Online trainings for beginners and advanced practitioners alike, across a breadth of topics including disaster management, ecological forecasting, agriculture, public health, air quality, and water resources management. Includes introductory materials for remote sensing, SAR, and NISAR in English and Spanish.nisar.jpl.nasa.gov
NISAR StoryMaps (opens in a new tab)
Interactive StoryMaps on SAR applications for floods, wildfires, land subsidence, oil slicks, and glacial motion.nisar.jpl.nasa.gov
NISAR Applications White Papers (opens in a new tab)
Brief 2-page overviews of relevant applications of NISAR data that provide societal benefit as identified by past NISAR Applications Workshops.uavsar.jpl.nasa.gov
UAVSAR Postcards (opens in a new tab)
False color composites of airborne UAVSAR data depicting various Earth processes.
Space agency partner resources
CSA (Canadian Space Agency)
donnees-data.asc-csa.gc.caNon-NASA site
Radarsat Constellation Mission (RCM) - Data (opens in a new tab)
The RADARSAT Constellation Mission (RCM) is Canada's new generation of Earth observation satellites. The RCM includes a trio of Earth observation satellites, capable of scanning Earth day or night and in any weather conditions. The RCM is designed to provide effective solutions in three main areas: Maritime surveillance (ice, surface wind, oil pollution and ship monitoring); Disaster management (mitigation, warning, response and recovery); and Ecosystem monitoring (agriculture, wetlands, forestry and coastal change monitoring).github.comNon-NASA site
Synthetic Aperture Radar python Tutorial (opens in a new tab)
This tutorial demonstrates how to work with SAR imagery using Python and QGIS. It includes easy and practical steps for accessing and visualizing data.donnees-data.asc-csa.gc.caNon-NASA site
RADARSAT 1 - Data (opens in a new tab)
Launched in November 1995, RADARSAT-1 provided Canada and the world with an operational radar satellite system capable of timely delivery of large amounts of data. Equipped with a powerful synthetic aperture radar (SAR) instrument, it acquired images of the Earth day or night, in all weather and through cloud cover, smoke, and haze. All data products in the Canadian RADARSAT-1 archive have been released under an open license.
National Space Activities Commission of Argentina (CONAE)
catalogos.conae.gov.arNon-NASA site
SAOCOM Catalogue (opens in a new tab)
Access CONAE's latest SAR mission, SAOCOM catalogue and general information to register, download the images. Download and processing tutorials. Register for a ONE CLICK Login Profile.argentina.gob.arNon-NASA site
SAOCOM Catalogue Registration (opens in a new tab)
Registration protocol to access SAOCOM catalogue with ONE CLICK Profile.
From the NASA Space Apps Challenge. The official page is the final word on this challenge.
Built in Athlone
The 2 projects Athlone teams submitted for this challenge at HackAthlone 2026, from the teams’ own Space Apps pages. Links open in a new tab.
- 2026
- 1st place in Athlone
- People’s Choice
HOUSEFAX
HouseFax is a satellite background check for any home in Ireland. About 50,000 Irish households already sit in high-risk flood zones, and once a home floods it can lose flood insurance for good. Yet the official flood maps don't show individual properties, so buyers and renters usually find out after they sign. HouseFax uses NASA-ISRO NISAR L-band radar, which sees water straight through Irish cloud, to check every radar pass for standing water around a home. It adds 25 years of NASA FIRMS fire detections and the live River Shannon level, and turns it all into a 0-100 score with a grade, a flood timeline and the questions to ask the landlord or seller. We processed 7 real NISAR GCOV passes (June to October 2026) over the Shannon from Athlone to Shannonbridge, detecting water in every 150 m cell from HV/HH backscatter. HouseFax runs as a web app, works on phones, and comes with a Chrome extension that grades listings on Daft.ie, Ireland's main property site. People get satellite evidence before they sign, not after.
Read moreShow less
Team: Aarush Prasad
- 2026
ROCKET BOYS
DRISHTI is a browser app for exploring surface change in NASA-ISRO NISAR (L-band) and ESA Sentinel-1 (C-band) radar images. It compares any two satellite passes over the same place, shows what got rougher or smoother, drapes the result over 3D terrain, tests which weather or earthquake conditions were unusual before each event, and explains the scene in plain language with Google Gemini. Built by Rocket Boys (Devesh Shetty and Pranav Sharma) for the NASA Space Apps Challenge 2026 challenge Dancing with the SARs, at Hack Athlone.
Read moreShow less
Team: Pranav Sharma, Devesh Uday Shetty