

Planet X and SPHEREx
Your challenge is to create a public-facing web tool to display images of the sky from SPHEREx mission, making it easy for anyone to quickly see how they change over time.
- 8 resources
- CSA (Canadian Space Agency)1 partner agency
- 5 min read
Summary
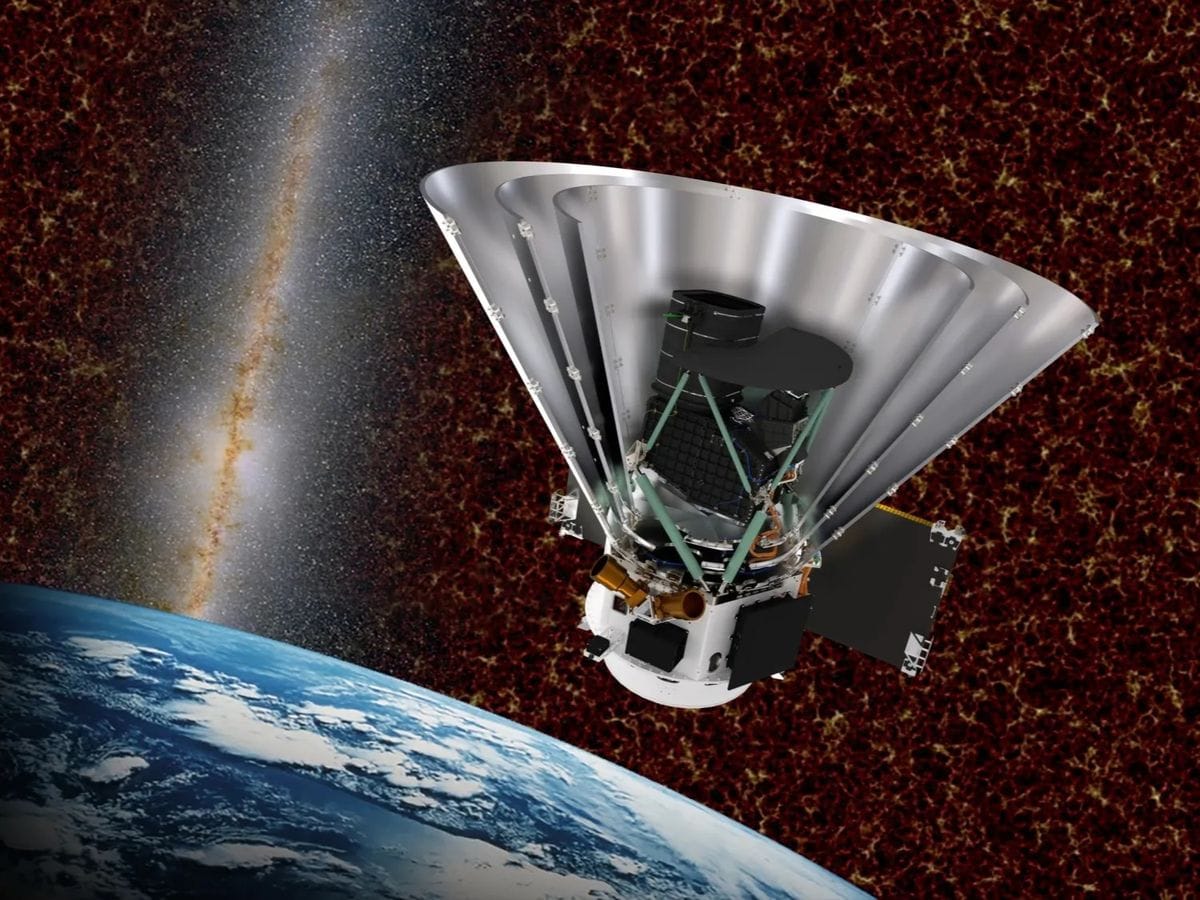
Since 2025, NASA’s SPHEREx mission has been mapping the entire sky every six months in 102 bands of near-infrared light, returning images of more than a billion objects. Comets, asteroids, stars, brown dwarfs, and even new planets reveal themselves by shifting position between images, but no one person can sift through all that data alone. Your challenge is to create a public-facing web tool to display images of the sky from SPHEREx mission, making it easy for anyone to quickly see how they change over time.
Background
Asteroids and comets orbit around the Sun. Nearby stars march across the sky as they orbit around the Galaxy. The Earth orbits the Sun too, causing objects near us to change their apparent positions. Watching for these motions help us discover new astronomical objects and also help measure the distances to these objects. For example, the dwarf planet Pluto was discovered when an astronomer compared two images of the sky taken at different times and recognized that one point of light had shifted between images.
More recently, astronomers have mounted massive searches for nearby objects using this process with help from the public. Hundreds of thousands of volunteers have used this technique to discover asteroids, comets, stars and brown dwarfs—balls of gas too massive to be considered planets yet without enough mass to burn like stars. In fact, most of the known comets and brown dwarfs were discovered by volunteers in this manner through projects like backyardworlds.org.
Since May 2025, NASA’s new SPHEREx mission has been returning unique data that could yield new discoveries. SPHEREx is mapping the whole sky once every six months in 102 bands of near-infrared light, making it uniquely sensitive to objects that are rich in hydrogen, water, carbon dioxide, carbon monoxide, and many other molecules. There will be too much data for any one person or even computer code to completely comprehend. There will be images of more than a billion objects - including brown dwarfs, quasars, comets, asteroids, stars, supernovae and galaxies - which often overlap or vary in brightness. We need your creative new tools to make the most of this treasure trove and help as many people as possible pitch in to make discoveries.
Objectives
Your challenge is to create a public-facing web tool to display images of the sky from the SPHEREx mission, making it easy for anyone to quickly see how they change over time. Users will enter the coordinates of a patch of sky (Right Ascension and declination). Your tool will display a series of images of that patch like a little video, making it easy to spot moving objects.
Test your tool on Barnard’s Star, Epsilon Indi B (a pair of brown dwarfs orbiting a star), WISE 0855 (a fast-moving brown dwarf Right Ascension 08h55m10.831s, declination -7d14m42.53s), and variable stars RW Aurigae and R Draconis.
Potential considerations
You may (but are not required to) consider the following:
- New SPHEREx data is arriving fast! Make sure to design a tool that’s easy to update with the latest data releases.
- Think creatively about how to display those 102 infrared bands so users can take advantage of them to make new discoveries! For example, it may make sense to separately add together all the data taken by each of the six detector arrays to improve the signal-to-noise in the images you display. Extra kudos if your tool can generate spectra on the fly.
- It may help users discover moving objects if they have the options to add together or subtract images taken at different times.
- Let users choose the field of view! Larger fields of view can make it possible to track faster-moving sources, at the cost of longer data transfer times.
- Users could benefit from having the option to overlay astronomical data from other telescopes, such as the Gaia mission or the WISE mission.
- If you make it possible to query your tool by including coordinates in the URL, users will be able to easily embed it in other websites and projects.
- It can be useful to display metadata, like contamination flags.
- Consider looking for publicly available tools that may help in handling astronomical data, like the Astrophy tools, and in displaying astronomical data, like the Aladin tool developed by the Strasbourg Astronomical Data Center (CDS).
NASA does not endorse any non-U.S. Government entity and is not responsible for information contained on non-U.S. Government websites. For non-U.S. Government websites, participants must comply with any data use parameters of that specific website.
NASA data and resources
irsa.ipac.caltech.eduNon-NASA site
NASA/IPAC Infrared Science Archive (opens in a new tab)
SPHEREx resourcescaltech-ipac.github.ioNon-NASA site
SPHEREx Tutorial Notebooks (opens in a new tab)
Example Jupyter notebooks for how to access the SPHEREx data via Python.byw.toolsNon-NASA site
WiseView (opens in a new tab)
A similar tool made for viewing data from an earlier NASA mission called WISE. It’s been used by the public to make hundreds of discoveries. Feel free to use it as a model or as inspiration!archive.stsci.eduNon-NASA site
Gaia Mission Data (opens in a new tab)
Be sure to use the latest data release (Data Release 3).
Space agency partner resources
CSA (Canadian Space Agency)
asc-csa.gc.caNon-NASA site
NEOSSat: Observing Asteroids, Space Debris and Exoplanets (opens in a new tab)
Learn about NEOSSat, the world's first space telescope dedicated to detecting and tracking asteroids, comets, satellites, and space debris. This CSA resource highlights how Canada is helping protect our understanding of near-Earth space by contributing to international efforts to identify and monitor objects that could pose risks to Earth or spacecraft.cadc-ccda.hia-iha.nrc-cnrc.gc.caNon-NASA site
Canadian Astronomy Data Centre (CADC) (opens in a new tab)
The CADC provides access to a vast collection of astronomical observations from Canadian and international telescopes and space missions. Through this resource, participants can explore real scientific data used by astronomers to study stars, galaxies, exoplanets, asteroids, and other celestial objects.github.comNon-NASA site
NEOSSat Data Tutorial (opens in a new tab)
This tutorial demonstrates how to use Python to visualize data from Canada's NEOSSat mission. Follow step-by-step instructions to access spacecraft observations, create visualizations, and explore data collected by Canada's space telescope.data.asc-csa.gc.caNon-NASA site
NEOSSat Dataset (opens in a new tab)
This dataset contains observations collected by NEOSSat, Canada's Near-Earth Object Surveillance Satellite. The data supports the detection and tracking of asteroids, comets, satellites, and space debris. Explore real observations from Canada's space telescope and learn how objects are monitored in near-Earth space.
From the NASA Space Apps Challenge. The official page is the final word on this challenge.
Built in Athlone
The 2 projects Athlone teams submitted for this challenge at HackAthlone 2026, from the teams’ own Space Apps pages. Links open in a new tab.
- 2026
BEYONDSIGHT
NASA’s SPHEREx mission launched in May 2025, has mapped 100% of the sky every six months across 102 near-infrared spectral bands(0.75"-" 5.0 μ"m)" , capturing over billion objects. This satellite captures a vast amount of data which no scientist or automated pipeline can sift through a billion overlapping sources alone, and raw Multi-Extension FITS archives lock out the public behind complex python workflows. BEYONDSIGHT is a public, mobile ready web application that transforms SPHEREx and Canadian Space Agency (CSA) NEOSSat archives into an interactive “Google Earth for the cosmos”. Featuring continuous multi-wavelength slider (visible to microwave across DSS, 2MASS, SPHEREx, WISE, IRAS, and Planck), a 384x384 multi-epoch blink and difference imaging comparator with yearly proper-motion rings, on-the-fly 102-band spectrophotometry, and Gaia DR3/NEOSSat overlays, BEYONDSIGHT puts cosmic discovery in everyone's hands, turning a billion points of infrared light into an interactive hunt for new worlds.
Read moreShow less
Team: Marta Maqueda, Rudra Priya Narayan Joshi, Jamie Cullen
- 2026
SkyDive
by Debugonauts
SkyDive is a web tool that turns any patch of sky into a movie covering sixteen years. Enter coordinates and it lines up WISE images from 2010 to 2024, Pan-STARRS epochs, and SPHEREx visits from 2025 onward in 102 infrared colours. You can play a video that iterates through frames, stack and subtract groups of visits so anything that moved or changed stands out, click a source to get its spectrum and light curve, and overlay Gaia, CatWISE, asteroid and variable-star catalogues, with each marker moved to the frame's date. A 3D map holds 331,802 stars and brown dwarfs within 100 parsecs, with a ±50,000-year time slider; click a star to open its SPHEREx view. A single SPHEREx pixel is 6.2″ across, so on its own SPHEREx cannot show slow motion. Adding the WISE frames stretches the baseline to sixteen years, and that makes the motion visible. Barnard's Star, for example, moves about 145″ across the WISE frames. The browser holds every aligned exposure, so stacking, choosing wavelengths and measuring spectra happen instantly, and anyone with a browser can search for moving or changing objects without downloading archive files or writing code.
Read moreShow less
Team: Mark Drohan, Daniel tyutyunkov